.:[Double Click To][Close]:.
Get Paid To Promote, Get Paid To Popup, Get Paid Display Banner


Showing posts with label faster web. Show all posts

Monday, May 9, 2011

Page Speed Online has a shiny new API

Andrew
Richard
By Andrew Oates and Richard Rabbat, Page Speed Team

A few weeks ago, we introduced Page Speed Online, a web-based performance analysis tool that gives developers optimization suggestions. Almost immediately, developers asked us to make an API available to integrate into other tools and their regression testing suites. We were happy to oblige.

Today, as part of Google I/O, we are excited to introduce the Page Speed Online API as part of the Google APIs. With this API, developers now have the ability to integrate performance analysis very simply in their command-line tools and web performance dashboards.

We have provided a getting started guide that helps you to get up and running quickly, understand the API, and start monitoring the performance improvements that you make to your web pages. Not only that, in the request, you’ll be able to specify whether you’d like to see mobile or desktop analysis, and also get Page Speed suggestions in one of the 40 languages that we support, giving API access to the vast majority of developers in their native or preferred language.

We’re also pleased to share that the WordPress plugin W3 Total Cache now uses the Page Speed Online API to provide Page Speed suggestions to WordPress users, right in the WordPress dashboard. “The Page Speed tool itself provides extremely pointed and valuable insight into performance pitfalls. Providing that tool via an API has allowed me to directly correlate that feedback with actionable solutions that W3 Total Cache provides.” said Frederick Townes, CTO Mashable and W3 Total Cache author.

Take the Page Speed Online API for a spin and send us feedback on our mailing list. We’d love to hear your experience integrating the new Page Speed Online API.


Andrew Oates is a Software Engineer on the Page Speed Team in Google's Cambridge, Massachusetts office. You can find him in the credits for the Pixar film Up.

Richard Rabbat is the Product Management Lead on the "Make the Web Faster" initiative. He has launched Page Speed, mod_pagespeed and WebP. At Google since 2006, Richard works with engineering teams across the world.

Posted by Scott Knaster, Editor

Thursday, May 5, 2011

Measure page load time with Google Analytics

Zhiheng
Phil
By Zhiheng Wang, Make the Web Faster Team, and Phil Mui, Google Analytics Team

At Google, we’re passionate about speed and making the web faster, and we’re glad to see that many website owners share the same idea. A faster web is better for both users and businesses. A slow-loading landing page not only impacts your conversion rate, but can also impact AdWords Landing Page Quality and ranking in Google search.

To improve the performance of your pages, you first need to measure and diagnose the speed of a page, which can be a difficult task. Furthermore, even with page speed measurements, it’s critical to look at page speed in the context of other web analytics data.

Therefore, we are thrilled to announce the availability of the Site Speed report in Google Analytics. With the Site Speed report you can measure the page load time across your site right within your Google Analytics account.


Uses for the Site Speed report

With the Site Speed report, not only will you be able to monitor the speed of your pages, you can also analyze it along with other analytics data, such as:
  • Content: Which landing pages are slowest?
  • Traffic sources: Which campaigns correspond to faster page loads overall?
  • Visitor: How does page load time vary across geographies?
  • Technology: Does your site load faster or slower for different browsers?

Setting up the Site Speed report

For now, page speed measurement is turned off by default, so you’ll only see 0s in the Site Speed report until you’ve enabled it. To start measuring site speed, you need to make a small change to your Analytics tracking code. We have detailed instructions in the Site Speed article in the Analytics Help Center. Once you’ve updated your tracking code, a small sample of pageviews will be used to calculate the page load time.

Bringing the Site Speed report into Google Analytics is an important step of the Make the Web Faster effort, and we look forward to your feedback on Site Speed.


Zhiheng Wang spends most of his time at work building stuff so others can serve the web better. He spends the rest of his time at home fixing stuff so his family can surf the web better.

Phil Mui is the Group Product Manager of Google Analytics and has been leading its development since its early days. He has a Ph.D. from MIT and a M.Phil. from Oxford where he was a Marshall Scholar.

Posted by Scott Knaster, Editor

Thursday, March 31, 2011

Introducing Page Speed Online, with mobile support


At Google, we’re striving to make the whole web fast. As part of that effort, we’re launching a new web-based tool in Google Labs, Page Speed Online, which analyzes the performance of web pages and gives specific suggestions for making them faster. Page Speed Online is available from any browser, at any time. This allows website owners to get immediate access to Page Speed performance suggestions so they can make their pages faster.


In addition, we’ve added a new feature: the ability to get Page Speed suggestions customized for the mobile version of a page, specifically smartphones. Due to the relatively limited CPU capabilities of mobile devices, the high round-trip times of mobile networks, and rapid growth of mobile usage, understanding and optimizing for mobile performance is even more critical than for the desktop, so Page Speed Online now allows you to easily analyze and optimize your site for mobile performance. The mobile recommendations are tuned for the unique characteristics of mobile devices, and contain several best practices that go beyond the recommendations for desktop browsers, in order to create a faster mobile experience. New mobile-targeted best practices include eliminating uncacheable landing page redirects and reducing the amount of JavaScript parsed during the page load, two common issues that slow down mobile pages today.

Page Speed Online is powered by the same Page Speed SDK that powers the Chrome and Firefox extensions and webpagetest.org.

Please give Page Speed Online a try. We’re eager to hear your feedback on our mailing list and find out how you’re using it to optimize your site.

Tuesday, March 22, 2011

Page Speed for Chrome, and in 40 languages!

(Cross-posted from the Google Webmaster Central Blog.)


Today we’re launching the most requested feature for Page Speed, Page Speed for Chrome. Now Google Chrome users can get Page Speed performance suggestions to make their sites faster, right inside the Chrome browser. We would like to thank all our users for your great feedback and support since we launched. We’re humbled that 1.4 M unique users are using the Page Speed extension and finding it useful to help with their web performance diagnosis.

Google Chrome support has always been high on our priority list but we wanted to get it right. It was critical that the same engine that powers the Page Speed Add-On for Firefox be used here as well. So we first built the Page Speed SDK, which we then integrated into the Chrome extension.

Page Speed for Chrome retains the same core features as the Firefox add-on. In addition, there are two major improvements appearing in this version first. We’ve improved scoring and suggestion ordering to help web developers focus on higher-potential optimizations first. Plus, because making the web faster is a global initiative, Page Speed now supports displaying localized rule results in 40 languages! These improvements are part of the Page Speed SDK, so they will also appear in the next release of our Firefox add-on as well.

If your site serves different content based on the browser’s user agent, you now have a good method for page performance analysis as seen by different browsers, with Page Speed coverage for Firefox and Chrome through the extensions, and Internet Explorer via webpagetest.org, which integrates the Page Speed SDK.

We’d love to hear from you, as always. Please try Page Speed for Chrome, and give us feedback on our mailing list about additional functionality you’d like to see. Stay tuned for updates to Page Speed for Chrome that take advantage of exciting new technologies such as Native Client.

Thursday, March 17, 2011

Your Web, Half a Second Sooner

At Google we’re constantly trying to make the web faster — not just our corner of it, but the whole thing. Over the past few days we’ve been rolling out a new and improved version of show_ads.js, the piece of JavaScript used by more than two million publishers to put AdSense advertisements on their web pages. The new show_ads is small and fast, built so that your browser can turn its attention back to its main task — working on the rest of the web page — as soon as possible. This change is now making billions of web pages every day load faster by half a second or more.

The old show_ads did lots of work: loading additional scripts, gathering information about the web page it was running on, and building the ad request to send back to Google. The new show_ads has a different job. It creates a friendly (same-origin) iframe on the web page, and starts the old script with a new name, show_ads_impl, running inside that iframe. The _impl does all the heavy lifting, and in the end the ads look exactly the same. But there’s a substantial speed advantage: many things happening inside an iframe don’t block the web browser’s other work.

How much of an effect this has depends on context: a page with nothing but ads on it isn’t going to get any faster. But on the real-world sites we tested, the latency overhead from our ads is basically gone. Page load times with the new asynchronous AdSense implementation are statistically indistinguishable from load times for the same pages with no ads at all.

The new show_ads is a drop-in replacement for the old one: web site owners don’t need to do anything to get this speed-up. But these dynamically-populated friendly iframes are finicky beasts. For now, we’re only using this technique on Chrome, Firefox, and Internet Explorer 8, with more to come once we’re sure that it plays well with other browsers.

And what if you’ve built a page that loads AdSense ads and then manipulates them in exotic ways not compatible with friendly iframes? (This is the web, after all, land of “What do you mean that’s ‘not supported’? I tried it, and it worked!”) You can set “google_enable_async = false” for any individual ad slot to revert to the old blocking behavior. But if your site loads ads in some tortuous way because you were looking for latency benefits, consider giving the straightforward invocation of show_ads.js a whirl. Because now, we’re fast.

Monday, January 31, 2011

Go Daddy Makes The Web Faster by enabling mod_pagespeed

As part of our Make The Web Faster initiative, Google announced the availability of mod_pagespeed, an open-source module for Apache webservers to automatically accelerate the sites they serve. Go Daddy, the top web hosting provider and world's largest domain name registrar, announced that they would roll out the mod_pagespeed feature for their Linux Web hosting customers. The feature is now available and is in use by Go Daddy customers who have already started to report faster webpage load times.

“Who on the Internet wouldn't want a faster website?” asked Go Daddy CEO and Founder Bob Parsons. “The benefits of mod_pagespeed are really a slam dunk. It’s built to boost users’ web performance, and ultimately, the bottom line for their business.”

By using several filters that implement web performance best practices, mod_pagespeed rewrites web page resources to automatically optimize their content. The filters improve performance for JavaScript, HTML and CSS, as well as JPEG and PNG images.

Mike Bender, co-creator of photo-blog AwkwardFamilyPhotos.com and Go Daddy customer, detected a 48% decrease, slicing the load time for his image-rich website from 12.8 to 6.6 seconds. mod_pagespeed speeds up the first visit of the site by reducing the payload size and improving compression. Repeat visits are accelerated by making caching more efficient and decreasing the size of resources such as CSS and HTML on the page as demonstrated in this chart (where smaller is faster):


“From the moment we enabled mod_pagespeed, the difference was noticeable,” said Bender. “It was a simple ‘flick of the switch,’ and the site started loading faster.”


For Go Daddy customers currently using the Linux 4GH web hosting platform, find out how to enable mod_pagespeed for your own website here. Other webmasters can install mod_pagespeed binaries or build directly from source.


Monday, November 22, 2010

Edmunds partners with Google to make the web faster

Note: This is a guest post from Ismail Elshareef, who is the Principal Architect at Edmunds.com. Thanks for the post and for making the web faster Ismail!

In the Fall of 2008, we embarked on a complete redesign of our car enthusiast site, insideline.com. One of the main redesign objectives was to deliver the fastest page load possible to our consumers. Leading up to that point, we have been closely following and implementing the performance best practices championed by Google's Make the Web Faster team and others. We understood the impact performance has on user experience and the bottom line.

Some of the many performance-enhancing features that have been implemented on insideline.com (and now on our beta.edmunds.com) are:
  1. Reducing the number of HTTP requests: We combined CSS and JavaScript files as necessary as well as using sprites and data URIs when appropriate. We have also reduced the number of blocking requests as much as possible to make the pages "feel" faster
  2. Serving static content from different domains: This helped maximize the browser parallel download capacity and made the request payload faster since no cookies were sent over the wire to those domains
  3. Using Expires headers: Caching static files in the client's browser to eliminate unnecessary, redundant requests to our servers
  4. Lazy-loading Page Modules: Render the bare minimum page components first so that the user sees something on the page, and then go through the modules and load them in order of priority. We developed a JavaScript Loader component to help us accomplish that which you can read more on the Edmunds technology blog.
  5. Managing 3rd-party components: iFrame components could be lazy-loaded without a problem. JavaScript components, on the other hand, need to be loaded onto the page before the onLoad event fires. That had the potential of slowing down our pages. The solution we devised was to delay the calling of those components until we initiate the lazy-loading of modules and right before the onLoad event fires
  6. Using non-blocking calls: With the browser being a single thread process, we optimized ways of including resources on the page without affecting page rendering so that the page is perceived to be fast by the user.

The results on insideline.com have been incredbile. Page load time went from 9 seconds on average on the old site to 1.5 seconds on average on the new one, and that's with loading in much richer content onto the page (measured with WebPageTest). We have also seen a 3% increase in ad revenue. On the beta.edmunds.com, which will replace our legacy site fully in December 2010, we have seen a 17% increase in page views and a 2% reduction in the bounce rate for our landing pages in a controlled experiment.

Although we have a long way to go in making our pages and services faster, we are very pleased of the progress we’ve made so far. Working with Google to make the web faster has been an exciting adventure that will continue with more improvements and innovations for both our sites and the web as a whole. Get more details on the Edmunds technology blog and try these enhancements on your site today.

Monday, November 15, 2010

Instant Previews: Under the hood

If you’ve used Google Search recently, you may have noticed a new feature that we’re calling Instant Previews. By clicking on the (sprited) magnifying glass icon next to a search result you see a preview of that page, often with the relevant content highlighted. Once activated, you can mouse over the rest of the results and quickly (instantly!) see previews of those search results, too.

Adding this feature to Google Search involved a lot of client-side Javascript. Being Google, we had to make sure we could deliver this feature without slowing down the page. We know our users want their results fast. So we thought we’d share some techniques involved in making this new feature fast.

JavaScript compilation

This is nothing new for Google Search: all our Javascript is compiled to make it as small as possible. We use the open-sourced Closure Compiler. In addition to minimizing the Javascript code, it also re-writes expressions, reuses variables, and prunes out code that is not being used. The Javascript on the search results page is deferred, and also cached very aggressively on the client side so that it’s not downloaded more than once per version.

On-demand JSONP

When you activate Instant Previews, the result previews are requested by your web browser.There are several ways to fetch the data we need using Javascript. The most popular techniques are XmlHttpRequest (XHR) and JSONP. XHR generally gives you better control and error-handling, but it has two drawbacks: browsers caching tends to be less reliable, and only same-origin requests are permitted (this is starting to change with modern browsers and cross-origin resource sharing, though). With JSONP, on the other hand, the requested script returns the desired data as a JSON object wrapped in a Javascript callback function, which in our case looks something like

google.vs.r({"dim":[302,585],"url":"http://example.com",ssegs:[...]}).

Although error handling with JSONP is a bit harder to do compared to XHR (not all browsers support onerror events), JSONP can be cached aggressively by the browser, and is not subject to same-origin restrictions. This last point is important for Instant Previews because web browsers restrict the number of concurrent requests that they send to any one host. Using a different host for the preview requests means that we don’t block other requests in the page.

There are a couple of tricks when using JSONP that are worth noting:

  • If you insert the script tag directly, e.g. using document.createElement, some browsers will show the page as still “loading” until all script requests are finished. To avoid that, make your DOM call to insert the script tag inside a window.setTimeout call.
  • After your requests come back and your callbacks are done, it’s a good idea to set your script src to null, and remove the tag. On some browsers, allowing too many script tags to accumulate over time may slow everything down.

Data URIs

At this point you are probably curious as to what we’re returning in our JSONP calls, and in particular, why we are using JSON and not just plain images. Perhaps you even used Firebug or your browser’s Developer Tools to examine the Instant Previews requests. If so, you will have noticed that we send back the image data as sets of data URIs. Data URIs are base64 encodings of image data, that modern browsers (IE8+, Chrome, Safari, Firefox, Opera, etc) can use to display images, instead of loading them from a server as usual.

To show previews, we need the image, and the relevant content of the page for the particular query, with bounding boxes that we draw on top of the image to show where that content appears on the page. If we used static images, we’d need to make one request for the content and one request for the image; using JSONP with data URIs, we make just one request. Data URIs are limited to 32K on IE8, so we send “slices” that are all under that limit, and then use Javascript to generate the necessary image tags to display them. And even though base64 encoding adds about 33% to the size of the image, our tests showed that gzip-compressed data URIs are comparable in size to the original JPEGs.

We use caching throughout our implementation, but it’s important to not forget about client-side caching as well. By using JSONP and data URIs, we limit the number of requests made, and also make sure that the browser will cache the data, so that if you refresh a page or redo a query, you should get the previews, well... instantly!

Wednesday, November 3, 2010

Make your websites run faster, automatically -- try mod_pagespeed for Apache

Last year, as part of Google’s initiative to make the web faster, we introduced Page Speed, a tool that gives developers suggestions to speed up web pages. It’s usually pretty straightforward for developers and webmasters to implement these suggestions by updating their web server configuration, HTML, JavaScript, CSS and images. But we thought we could make it even easier -- ideally these optimizations should happen with minimal developer and webmaster effort.

So today, we’re introducing a module for the Apache HTTP Server called mod_pagespeed to perform many speed optimizations automatically. We’re starting with more than 15 on-the-fly optimizations that address various aspects of web performance, including optimizing caching, minimizing client-server round trips and minimizing payload size. We’ve seen mod_pagespeed reduce page load times by up to 50% (an average across a rough sample of sites we tried) -- in other words, essentially speeding up websites by about 2x, and sometimes even faster.

(Video comparison of the AdSense blog site with and without mod_pagespeed)

Here are a few simple optimizations that are a pain to do manually, but that mod_pagespeed excels at:

  • Making changes to the pages built by the Content Management Systems (CMS) with no need to make changes to the CMS itself,
  • Recompressing an image when its HTML context changes to serve only the bytes required (typically tedious to optimize manually), and
  • Extending the cache lifetime of the logo and images of your website to a year, while still allowing you to update these at any time.

We’re working with Go Daddy to get mod_pagespeed running for many of its 8.5 million customers. Warren Adelman, President and COO of Go Daddy, says:

"Go Daddy is continually looking for ways to provide our customers the best user experience possible. That's the reason we partnered with Google on the 'Make the Web Faster' initiative. Go Daddy engineers are seeing a dramatic decrease in load times of customers' websites using mod_pagespeed and other technologies provided. We hope to provide the technology to our customers soon - not only for their benefit, but for their website visitors as well.”

We’re also working with Cotendo to integrate the core engine of mod_pagespeed as part of their Content Delivery Network (CDN) service.

mod_pagespeed integrates as a module for the Apache HTTP Server, and we’ve released it as open-source for Apache for many Linux distributions. Download mod_pagespeed for your platform and let us know what you think on the project’s mailing list. We hope to work with the hosting, developer and webmaster community to improve mod_pagespeed and make the web faster.

Thursday, September 30, 2010

WebP, a new image format for the Web

Cross-posted from the Chromium Blog

As part of Google’s initiative to make the web faster, over the past few months we have released a number of tools to help site owners speed up their websites. We launched the Page Speed Firefox extension to evaluate the performance of web pages and to get suggestions on how to improve them, we introduced the Speed Tracer Chrome extension to help identify and fix performance problems in web applications, and we released a set of closure tools to help build rich web applications with fully optimized JavaScript code. While these tools have been incredibly successful in helping developers optimize their sites, as we’ve evaluated our progress, we continue to notice a single component of web pages is consistently responsible for the majority of the latency on pages across the web: images.

Most of the common image formats on the web today were established over a decade ago and are based on technology from around that time. Some engineers at Google decided to figure out if there was a way to further compress lossy images like JPEG to make them load faster, while still preserving quality and resolution. As part of this effort, we are releasing a developer preview of a new image format, WebP, that promises to significantly reduce the byte size of photos on the web, allowing web sites to load faster than before.

Images and photos make up about 65% of the bytes transmitted per web page today. They can significantly slow down a user’s web experience, especially on bandwidth-constrained networks such as a mobile network. Images on the web consist primarily of lossy formats such as JPEG, and to a lesser extent lossless formats such as PNG and GIF. Our team focused on improving compression of the lossy images, which constitute the larger percentage of images on the web today.

To improve on the compression that JPEG provides, we used an image compressor based on the VP8 codec that Google open-sourced in May 2010. We applied the techniques from VP8 video intra frame coding to push the envelope in still image coding. We also adapted a very lightweight container based on RIFF. While this container format contributes a minimal overhead of only 20 bytes per image, it is extensible to allow authors to save meta-data they would like to store.

While the benefits of a VP8 based image format were clear in theory, we needed to test them in the real world. In order to gauge the effectiveness of our efforts, we randomly picked about 1,000,000 images from the web (mostly JPEGs and some PNGs and GIFs) and re-encoded them to WebP without perceptibly compromising visual quality. This resulted in an average 39% reduction in file size. We expect that developers will achieve in practice even better file size reduction with WebP when starting from an uncompressed image.

To help you assess WebP’s performance with other formats, we have shared a selection of open-source and classic images along with file sizes so you can visually compare them on this site. We are also releasing a conversion tool that you can use to convert images to the WebP format. We’re looking forward to working with the browser and web developer community on the WebP spec and on adding native support for WebP. While WebP images can’t be viewed until browsers support the format, we are developing a patch for WebKit to provide native support for WebP in an upcoming release of Google Chrome. We plan to add support for a transparency layer, also known as alpha channel in a future update.

We’re excited to hear feedback from the developer community on our discussion group, so download the conversion tool, try it out on your favorite set of images, and let us know what you think.

Thursday, September 2, 2010

Drupal 7 - faster than ever

This is a guest post by Owen Barton, partner and director of engineering at CivicActions. Owen has been working with Google's “Make the Web Faster” project team and the Drupal community to make improvements in Drupal 7 front-end performance. This is a condensed version of a more in-depth post over at the CivicActions blog.


Drupal is a popular free and open source publishing platform, powering high profile sites such as The White House, The New York Observer and Amnesty International. The Drupal community has long understood the importance of good front-end performance to successful web sites, being ahead of the game in many ways. This post highlights some of the improvements developed for the upcoming Drupal 7 release, several of which can save an additional second or more of page load times.


Drupal 7 has made its caching system more easily pluggable - to allow for easier memcache integration, for example. It has also enabled caching HTTP headers to be set so that logged out users can cache entire pages locally as well as improve compatibility with reverse proxies and content distribution networks (CDNs). There is also a patch waiting which reduces both the response size and the time taken to generate 404 responses for inlined page assets. Depending on the type of 404 (CSS have a larger effect than images, for example) the slower 404s were adding 0.5 to 1 second to the calling page load times.


Drupal currently has the ability to aggregate multiple CSS and JavaScript files by concatenating them into a smaller number of files to reduce the number of HTTP requests. There is a patch in the queue for Drupal 7 that could allow aggregation to be enabled by default, which is great because the large number of individual files can add anything from 0-1.5 seconds to page loads.


One issue that has become apparent with the Drupal 6 aggregation system is that users can end up downloading aggregate files that include a large amount of duplicate code. On one page the aggregate may contain files a, b and c, whilst on a second page the aggregate may contain files a, b and d - the “c” and “d” files being added conditionally on specific pages. This breaks the benefits of browser caching and slows down subsequent page loads. Benchmarking on core alone shows that avoiding duplicate aggregates can save over a second across 5 page loads. A patch has already been committed that means files need to be explicitly added to the aggregate, and fix Drupal core to add appropriate files to the aggregate unconditionally.


Drupal has supported gzip compression of HTML output for a long time, however for CSS and JavaScript, the files are delivered directly by the webserver, so Drupal has less control. There are webserver based compressors such as Apache’s mod_deflate, but these are not always available. A patch is in the queue that stores compressed versions of aggregated files on write and uses rewrite and header directives in .htaccess that allow these files to be served correctly. Benchmarks show that this patch can make initial page views 20-60% faster, saving anything from 0.3 to 3 seconds total.


The Drupal 7 release promises some real improvements from a front-end performance point of view. Other performance optimizations will no doubt continue to appear and be refined in contributed modules and themes, as well as in site building best practices and documentation. In Drupal 8 we will hopefully see further improvements in the CSS/JS file aggregation system, increased high-level caching effectiveness and hopefully more tools to help site builders reduce file sizes. If you have yet to try Drupal, download it now and give it a try and tell us in the comments if your site performance improves!


Thursday, June 10, 2010

Page Speed for ads and trackers

At Google, we're passionate about making the web faster. To help web page owners optimize their pages for speed, we open-sourced the Page Speed web performance tool a year ago. Today, we're excited to launch a new Page Speed feature: Page Speed for ads, such as display and rich media ads, and trackers, also known as analytics.

Page Speed now enables developers to run a performance analysis of the ads, the trackers, or the remaining content of the page. Web developers can use Page Speed to determine how ads and trackers impact the performance of their web pages, and ad and tracker providers can use this feature to tune their services for speed.

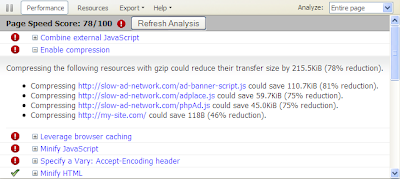
For instance, when analyzing an example web page, Page Speed displays several suggestions that we can apply to make the page faster:


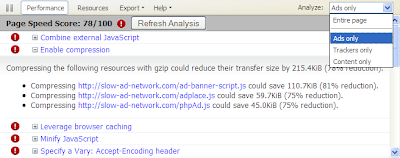
But which of these suggestions applies to the content on the page that we authored? Which apply to the ads and trackers? Using the "Analyze"menu, we can determine that, in this example, the ads are contributing to slowing down the page:


When we switch to analyze the content of the page, the score for the page improves to 93. We can in this case enable compression for the resource that is served uncompressed currently.


We hope that you try these and other new features and rules of Page Speed and find them useful to further optimize the speed of your web pages.

Please share your experience using this new feature in our discussion forum.

Monday, March 22, 2010

Making APIs Faster: Introducing Partial Response and Partial Update

At Google, we strive to make the web faster. Today, we’re proud to take our first big step in making APIs faster by introducing two experimental features in the Google Data Protocol, partial response and partial update. Together, partial response and partial update can drastically reduce the network, memory, and CPU resources needed to work with Google APIs.

It’s easy to understand the benefit of partial response and partial update. Imagine that you are writing a new Android calendar widget, and you want to display the time and title of the recently changed events on your Google Calendar. With the old Calendar Data API, you would request your calendar’s events feed and receive a large amount of information in response -- including lots of extra data like the attendee list and the event description.

With the addition of partial response, however, you can now use the fields query parameter to request only relevant information -- in this case, event titles and times. Constructing such a request using the fields query parameter is simple:

GET http://www.google.com/calendar/feeds/zachpm@google.com/private/full?fields=entry(title,gd:when)

By including the entry argument and specifying title and gd:when, this request ensures that the partial response contains only the title and time for each event, along with a small amount of wrapping metadata.

But say you want to also enable the widget to change the time of calendar events. With partial update, you can easily accomplish this: simply edit the data you received in the partial response and use the HTTP PATCH verb to send the modified data back to the server. The server then intelligently interprets your PATCH, updating only the fields you chose to send. Throughout this entire read-modify-write cycle, the unneeded data remains server-side and untouched.

Now for a quick demo. If you’re currently logged into a Google account, compare the size of your full calendar feed and your partial calendar feed. When we ran this test, our full calendar feed contained 160 kB of data while the partial feed only contained 8 kB -- the partial response successfully reduced total data transfer by 95%! Performance enhancements like this are especially apparent on a mobile device, where every byte of memory and every CPU cycle count. In nearly all clients, partial response and partial update make it more efficient to send, store, parse, cache, and modify only the data that you need.

As of today, partial response and partial update are supported in four Google APIs:
... and we’re planning on adding support for most of the APIs that are built on the Google Data Protocol soon. Stay tuned for more information, and if you can’t wait, feel free to lobby for partial update and partial response in your favorite API’s public support group. And for those of you who’ll be at Google I/O this year, be sure to check out the Google API sessions that are in store.

Thanks for joining us in our effort to make APIs on the web as fast and as efficient as possible!

Monday, December 21, 2009

A look back on 2009

2009 was a remarkable year for developers. Vic Gundotra, VP of our developer team declared at Google I/O, "The web has won!" and this year was full of launches and announcements that remind us how the web has become the platform of our day. We found lots of inspiration from the developers at Google I/O in San Francisco and at our Google Developer Days in Japan, China, Brazil, Russia and the Czech Republic.


Here's a look back at some of our favorite highlights from 2009:
It is a very exciting time to be a developer...we are just starting to see what is possible with the web as the platform. It will be a lot of fun to see where all of us, together, can take the web in 2010!

Happy Holidays from the Google Developer Team!

Tuesday, December 8, 2009

Google Web Toolkit 2.0 - now with Speed Tracer

Tonight at a Google Campfire One we released Google Web Toolkit 2.0, aiming to do two main things for developers:
  • Make it easier to build faster apps
  • Speed up the overall development cycle
This is a very exciting release because it's the cumulation of a year and a half working with teams like Google Wave, AdWords, and Orkut (among many others inside and outside of Google) to evolve GWT to meet the needs of today's web applications. There are many features and improvements, but let me call out three which we're especially excited about.

Faster Apps

Introducing: Performance profiling with Speed Tracer
The first thing you'll notice in 2.0 is that we've added a new tool called Speed Tracer. Speed Tracer is a performance profiler for Google Chrome that allows developers to see what's going on in a way which hasn't been possible before. We've worked closely with the Webkit community to add instrumentation in the browser to enable developers to gain deep insights into how code behaves, uncovering problems which have been hidden up till now.

Introducing: Incremental app download with code splitting
Another feature we've added into Google Web Toolkit is developer-guided code splitting. Code splitting allows a developer to split up their application for much, much faster startup times. Imagine if you have a settings page that users go to once a week. Why download that JavaScript when the application starts up? With code splitting, your users download just the JavaScript they need to get started.

Faster Development

Introducing: Declarative UI with UiBinder
UiBinder is a new declarative UI framework in Google Web Toolkit which enables rapid design iteration and a clean separation between presentation layer and application logic.

Dive into the details and more features in GWT 2.0.


Thursday, December 3, 2009

Introducing Google Public DNS: A new DNS resolver from Google

Today, as part of our efforts to make the web faster, we are announcing Google Public DNS, a new experimental public DNS resolver.

The DNS protocol is an important part of the web's infrastructure, serving as the Internet's "phone book". Every time you visit a website, your computer performs a DNS lookup. Complex pages often require multiple DNS lookups before they complete loading. As a result, the average Internet user performs hundreds of DNS lookups each day, that collectively can slow down his or her browsing experience.

We believe that a faster DNS infrastructure could significantly improve the browsing experience for all web users. To enhance DNS speed but to also improve security and validity of results, Google Public DNS is trying a few different approaches that we are sharing with the broader web community through our documentation:
  • Speed: Resolver-side cache misses are one of the primary contributors to sluggish DNS responses. Clever caching techniques can help increase the speed of these responses. Google Public DNS implements prefetching: before the TTL on a record expires, we refresh the record continuously, asychronously and independently of user requests for a large number of popular domains. This allows Google Public DNS to serve many DNS requests in the round trip time it takes a packet to travel to our servers and back.

  • Security: DNS is vulnerable to spoofing attacks that can poison the cache of a nameserver and can route all its users to a malicious website. Until new protocols like DNSSEC get widely adopted, resolvers need to take additional measures to keep their caches secure. Google Public DNS makes it more difficult for attackers to spoof valid responses by randomizing the case of query names and including additional data in its DNS messages.

  • Validity: Google Public DNS complies with the DNS standards and gives the user the exact response his or her computer expects without performing any blocking, filtering, or redirection that may hamper a user's browsing experience.
We hope that you will help us test these improvements by using the Google Public DNS service today, from wherever you are in the world. We plan to share what we learn from this experimental rollout of Google Public DNS with the broader web community and other DNS providers, to improve the browsing experience for Internet users globally.

To get more information on Google Public DNS you can visit our site, read our documentation, and our logging policies. We also look forward to receiving your feedback in our discussion group.

Monday, November 9, 2009

Use compression to make the web faster

Every day, more than 99 human years are wasted because of uncompressed content. Although support for compression is a standard feature of all modern browsers, there are still many cases in which users of these browsers do not receive compressed content. This wastes bandwidth and slows down users' interactions with web pages.

Uncompressed content hurts all users. For bandwidth-constrained users, it takes longer just to transfer the additional bits. For broadband connections, even though the bits are transferred quickly, it takes several round trips between client and server before the two can communicate at the highest possible speed.  For these users the number of round trips is the larger factor in determining the time required to load a web page. Even for well-connected users these round trips often take tens of milliseconds and sometimes well over one hundred milliseconds.

In Steve Souders' book Even Faster Web Sites, Tony Gentilcore presents data showing the page load time increase with compression disabled.  We've reproduced the results for three highest ranked sites from the Alexa top 100 with permission here:

Data, with permission, from Steve Souders, "Chapter 9: Going Beyond Gzipping," in Even Faster Web Sites (Sebastapol, CA: O'Reilly, 2009), 122.


The data from Google's web search logs show that the average page load time for users getting uncompressed content is 25% higher compared to the time for users getting compressed content. In a randomized experiment where we forced compression for some users who would otherwise not get compressed content, we measured a latency improvement of 300ms.  While this experiment did not capture the full difference, that is probably because users getting forced compression have older computers and older software.

We have found that there are 4 major reasons why users do not get compressed content: anti-virus software, browser bugs, web proxies, and misconfigured web servers.  The first three modify the web request so that the web server does not know that the browser can uncompress content. Specifically, they remove or mangle the Accept-Encoding header that is normally sent with every request.

Anti-virus software may try to minimize CPU operations by intercepting and altering requests so that web servers send back uncompressed content.  But if the CPU is not the bottleneck, the software is not doing users any favors.  Some popular antivirus programs interfere with compression.  Users can check if their anti-virus software is interfering with compression by visiting the browser compression test page at Browserscope.org.

By default, Internet Explorer 6 downgrades to HTTP/1.0 when behind a proxy, and as a result does not send the Accept-Encoding request header. The table below, generated from Google's web search logs, shows that IE 6 represents 36% of all search results that are sent without compression.  This number is far higher than the percentage of people using IE 6.

Data from Google Web Search Logs

There are a handful of ISPs,  where the percentage of uncompressed content is over 95%.  One likely hypothesis is that either an ISP or a corporate proxy removes or mangles the Accept-Encoding header.  As with anti-virus software, a user who suspects an ISP is interfering with compression should visit the browser compression test page at Browserscope.org.

Finally, in many cases, users are not getting compressed content because the websites they visit are not compressing their content.  The following table shows a few popular websites that do not compress all of their content. If these websites were to compress their content, they could decrease the page load times by hundreds of milliseconds for the average user, and even more for users on modem connections.

Data generated using Page Speed

To reduce uncompressed content, we all need to work together.
  • Corporate IT departments and individual users can upgrade their browsers, especially if they are using IE 6 with a proxy. Using the latest version of Firefox, Internet ExplorerOpera, Safari, or Google Chrome will increase the chances of getting compressed content.  A recent editorial in IEEE Spectrum lists additional reasons - besides compression - for upgrading from IE6.
  • Anti-virus software vendors can start handling compression properly and would need to stop removing or mangling the Accept-Encoding header in upcoming releases of their software.
  • ISPs that use an HTTP proxy which strips or mangles the Accept-Encoding header can upgrade, reconfigure or install a better proxy which doesn't prevent their users from getting compressed content.
  • Webmasters can use Page Speed (or other similar tools) to check that the content of their pages is compressed.
For more articles on speeding up the web, check out http://code.google.com/speed/articles/.

Thursday, November 5, 2009

Introducing Closure Tools

Millions of Google users worldwide use JavaScript-intensive applications such as Gmail, Google Docs, and Google Maps. Like developers everywhere, Googlers want great web apps to be easier to create, so we've built many tools to help us develop these (and many other) apps. We're happy to announce the open sourcing of these tools, and proud to make them available to the web development community.

Closure Compiler
Closure Compiler is a JavaScript optimizer that compiles web apps down into compact, high-performance JavaScript code. The compiler removes dead code, then rewrites and minimizes what's left so that it will run fast on browsers' JavaScript engines. The compiler also checks syntax, variable references, and types, and warns about other common JavaScript pitfalls. These checks and optimizations help you write apps that are less buggy and easier to maintain. You can use the compiler with Closure Inspector, a Firebug extension that makes debugging the obfuscated code almost as easy as debugging the human-readable source.

Because JavaScript developers are a diverse bunch, we've set up a number of ways to run the Closure Compiler. We've open-sourced a command-line tool. We've created a web application that accepts your code for compilation through a text box or a RESTful API. We are also offering a Firefox extension that you can use with Page Speed to conveniently see the performance benefits for your web pages.

Closure Library
Closure Library is a broad, well-tested, modular, and cross-browser JavaScript library. Web developers can pull just what they need from a wide set of reusable UI widgets and controls, as well as lower-level utilities for the DOM, server communication, animation, data structures, unit testing, rich-text editing, and much, much more. (Seriously. Check the docs.)

JavaScript lacks a standard class library like the STL or JDK. At Google, Closure Library serves as our "standard JavaScript library" for creating large, complex web applications. It's purposely server-agnostic and intended for use with the Closure Compiler. You can make your project big and complex (with namespacing and type checking), yet small and fast over the wire (with compilation). The Closure Library provides clean utilities for common tasks so that you spend your time writing your app rather than writing utilities and browser abstractions.

Closure Templates
Closure Templates grew out of a desire for web templates that are precompiled to efficient JavaScript.  Closure Templates have a simple syntax that is natural for programmers.  Unlike traditional templating systems, you can think of Closure Templates as small components that you compose to form your user interface, instead of having to create one big template per page.

Closure Templates are implemented for both JavaScript and Java, so you can use the same templates both on the server and client side.


Closure Compiler, Closure Library, Closure Templates, and Closure Inspector all started as 20% projects and hundreds of Googlers have contributed thousands of patches. Today, each Closure Tool has grown to be a key part of the JavaScript infrastructure behind web apps at Google.  That's why we're particularly excited (and humbled) to open source them to encourage and support web development outside Google. We want to hear what you think, but more importantly, we want to see what you make. So have at it and have fun!

Wednesday, June 10, 2009

Gmail for Mobile HTML5 Series: Suggestions for Better Performance

On April 7th, Google launched a new version of Gmail for mobile for iPhone and Android-powered devices. We shared the behind-the-scenes story through this blog and decided to share more of our learnings in a brief series of follow-up blog posts. This week, I'll talk about a few small things you can do to improve performance of your HTML5-based applications. Our focus here will be on performance bottlenecks related to the database and AppCache.

Optimizing Database Performance

There are hundreds of books written about optimizing SQL and database performance, so I won't bother to get into these details, but instead focus on things which are of particular interest for mobile HTML5 apps.

Problem: Creating and deleting tables is slow! It can take upwards of 200 ms to create or delete a table. This means a simple database schema with 10 tables can easily take 2-4 seconds (or more!) just to delete and recreate the tables. Since this often needs to be done at startup time, this really hurts your launch time.

Solution: Smart versioning and backwards compatible schema changes (whenever possible). A simple way of doing this is to have a VERSION table with a single row that includes the version number (e.g., 1.0). For backwards-compatible version changes, just update the number after the decimal (e.g., 1.1) and apply any updates to the schema. For changes that aren't backwards compatible, update the number before the decimal (e.g., 2.0) at which point you can drop all the tables and recreate them all. With a reasonable schema design to begin with, it should be very rare that a schema change is not backwards compatible and even if this happens every month or so, users should get to use your application 20, 30 even 100 times before they hit this startup delay again. If your schema changes very infrequently, a simple 1, 2, 3 versioning scheme will probably work fine; just make sure to only recreate the database when the version changes!

Problem: Queries are slow! Queries are faster than creates and updates, but they can still take 100ms-150ms to execute. It's not uncommon for traditional applications to execute dozens or even hundreds of queries at startup – on mobile this is not an option.

Solution: Defer and/or combine queries. Any queries that can be deferred from startup (or at any other significant point in the application) should be deferred until the data is absolutely needed. Adding 2-3 more queries on a user-driven operation can turn an action from appearing instantaneous to feeling unresponsive. Any queries that are performed at startup should be optimized to require as few hits to the database as possible. For example, if you're storing data about books and magazines, you could use the following two queries to get all the authors along with the number of books and magazine articles they've writen:

SELECT Author, COUNT(*) as NumArticles
FROM Magazines
GROUP BY Author
ORDER BY NumArticles;

SELECT Author, COUNT(*) as NumBooks
FROM Books
GROUP BY Author
ORDER BY NumBooks;


This will work fine, but the additional query will generally cost you about 100-200 ms over a different (albeit less pretty) query like:

SELECT Author, NumPublications, PubType
FROM (
SELECT Author, COUNT(*) as NumPublications, 'Magazine' as PubType, 0 as SortIndex
FROM Magazines
GROUP BY Author
UNION
SELECT Author, COUNT(*) as NumPublications, 'Book' as PubType, 1 as SortIndex
FROM Books
GROUP BY Author
)
ORDER BY SortIndex, NumPublications;

This will return all the entries we want, with the magazine entries first in increasing order of number of articles, followed by the book entries, in increasing order of the number of books. This is a toy example and there are clearly other ways of improving this, such as merging the Magazines and Books tables, but this type of scenario shows up all the time. There's always a trade-off between simplicity and speed when dealing with databases, but in the case of HTML5 on mobile, this trade-off is even more important.

Problem: Multiple updates is slow!

Solution: Use Triggers whenever possible. When the result of a database update requires updating other rows in the database, try to do it via SQL triggers. For example, let's say you have a table called Books listing all the books you own and another called Authors storing the names of all the authors of books you own. If you give a book away, you'll want to remove it from the Books table. However, if this was the only book you owned by that author, you would also want to remove the author from the Authors table. This can be done with two UPDATE statements, but a "better" way is to write a trigger that automatically deletes the author from the Authors table when the last book by this author is removed. This will execute faster and because triggers happen asynchronously in the background, it will have less of an impact on the UI than executing two statements. Here's an example of a simple trigger for this case:

CREATE TRIGGER IF NOT EXISTS RemoveAuthor
AFTER DELETE ON Books
BEGIN
DELETE FROM Authors
WHERE Author NOT IN
(SELECT Author
FROM Books);
END;
We'll get into more detail on triggers and how to use them in another performance post to come.

Optimizing AppCache Performance

Problem: Logging in is slow!

Solution: Avoid redirects to the login page. App-Cache is great because it can launch the application without needing to hit the network, which makes it much faster and allows you to launch offline. One problem you might encounter though, is that the application will launch and then you'll need to hit the network to get some data for the current user. At this point you'll have to check that the user is authenticated and it might turn out that they're not (e.g., their cookies might have expired or have been deleted). One option is to redirect the user to a login page somewhere, allow him to authenticate and then redirect him back to the application. Regardless of whether or not the login page is listed in the manifest, when it redirects back to your application, the entire application will reload. A nicer approach is for the application itself to display an authentication interface which sends the credentials and does the authentication seamlessly in the background. This will avoid any additional reloads of the application and makes everything feel faster and better integrated.

Problem: AppCache reloading causes my app to be slow!

Solution: List as few URLs in the manifest as possible. In a series of posts on code.google.com, we talked about the HTML5 AppCache manifest file. An important aspect of the manifest file is that when the version gets updated, all the URLs listed in the file are fetched again. This happens in the background while the user is using the application, but opening all these network connections and transferring all that data can cause the application to slow down considerably during this process. Try to setup your application so that all the resources can be fetched from as few URLs as possible to speed up the manifest download and minimize this effect. Of course you could also just never update your manifest version, but what's the point of having rapid development if you never make any changes?


That's a brief intro to some performance considerations when developing HTML5 applications. These are all issues that we ran into ourselves and have either fixed or are in the process of fixing in our application. I hope this helps you to avoid some of the issues we ran into and makes your application blazing fast!

We plan to write several more performance related posts in the future, but for now stay tuned for next post where we'll discuss the cache pattern for building offline capable web applications.


Previous posts from Gmail for Mobile HTML5 Series
HTML5 and Webkit pave the way for mobile web applications
Using AppCache to launch offline - Part 1
Using AppCache to launch offline - Part 2
Using AppCache to launch offline - Part 3
A Common API for Web Storage

Tuesday, June 9, 2009

Nicholas C. Zakas: Speed Up Your JavaScript

Nicholas C. Zakas delivers the seventh Web Exponents tech talk at Google. Nicholas is a JavaScript guru and author working at Yahoo!. Most recently we worked together on my next book, Even Faster Web Sites. Nicholas contributed the chapter on Writing Efficient JavaScript, containing much of the sage advice found in this talk. Check out his slides and watch the video.


Nicholas starts by asserting that users have a greater expectation that sites will be fast. Web developers need to do most of the heavy lifting to meet these expectations. Much of the slowness in today's web sites comes from JavaScript. In this talk, Nicholas gives advice in four main areas: scope management, data access, loops, and DOM.

Scope Management: When a symbol is accessed, the JavaScript engine has to walk the scope chain to find that symbol. The scope chain starts with local variables, and ends with global variables. Using more local variables and fewer global variables results in better performance. One way to move in this direction is to store a global as a local variable when it's referenced multiple times within a function. Avoiding with also helps, because that adds more layers to the scope chain. And make sure to use var when declaring local variables, otherwise they'll end up in the global space which means longer access times.

Data Access: In JavaScript, data is accessed four ways: as literals, variables, object properties, and array items. Literals and variables are the fastest to access, although the relative performance can vary across browsers. Similar to global variables, performance can be improved by creating local variables to hold object properties and array items that are referenced multiple times. Also, keep in mind that deeper object property and array item lookup (e.g., obj.name1.name2.name3) is slower.

Loops: Nicholas points out that for-in and for each loops should generally be avoided. Although they provide convenience, they perform poorly. The choices when it comes to loops are for, do-while, and while. All three perform about the same. The key to loops is optimizing what is performed at each iteration in the loop, and the number of iterations, especially paying attention to the previous two performance recommendations. The classic example here is storing an array's length as a local variable, as opposed to querying the array's length property on each iteration through a loop.

DOM: One of the primary areas for optimizing your web application's interaction with the DOM is how you handle HTMLCollection objects: document.images, document.forms, etc., as well as the results of calling getElementsByTagName() and getElementsByClassName(). As noted in the HTML spec, HTMLCollections "are assumed to be live meaning that they are automatically updated when the underlying document is changed." Any idea how long this code takes to execute?

var divs = document.getElementsByTagName("div");
for (var i=0; i < divs.length; i++) {
var div = document.createElement("div");
document.body.appendChild(div);
}

This code results in an infinite loop! Each time a div is appended to the document, the divs array is updated, incrementing the length so that the termination condition is never reached. It's best to think of HTMLCollections as live queries instead of arrays. Minimizing the number of times you access HTMLCollection properties (hint: copy length to a local variable) is a win. It can also be faster to copy the HTMLCollection into a regular array when the contents are accessed frequently (see the slides for a code sample).

Another area for improving DOM performance is reflow - when the browser computes the page's layout. This happens more frequently than you might think, especially for web applications with heavy use of DHTML. If you have code that makes significant layout changes, consider making the changes within a DocumentFragment or setting the className property to alter styles.

There is hope for a faster web as browsers come equipped with JIT compilers and native code generation. But the legacy of previous, slower browsers will be with us for quite a while longer. So hang in there. With evangelists like Nicholas in the lead, it's still possible to find your way to a fast, efficient web page.


Check out other blog posts and videos in the Web Exponents speaker series: